
Analysis and processing of monitoring
Trader’s Diary or trade monitoring. What is it for?
- null
- First of all, for your own analysis. Monitoring will show detailed statistics of your trading. Analyzing the indicators you can see your strengths and weaknesses and make adjustments to your trading system.
- For public analysis. Traders sometimes are looking for investors, such monitoring will help to confirm trader’s statistics being an independent source of profitability proof.
- For funds and investment companies. Monitoring will help to trace statistics of traders working in a company.
The monitoring consists of 4 main blocks. Below is an overview of each of them in order.
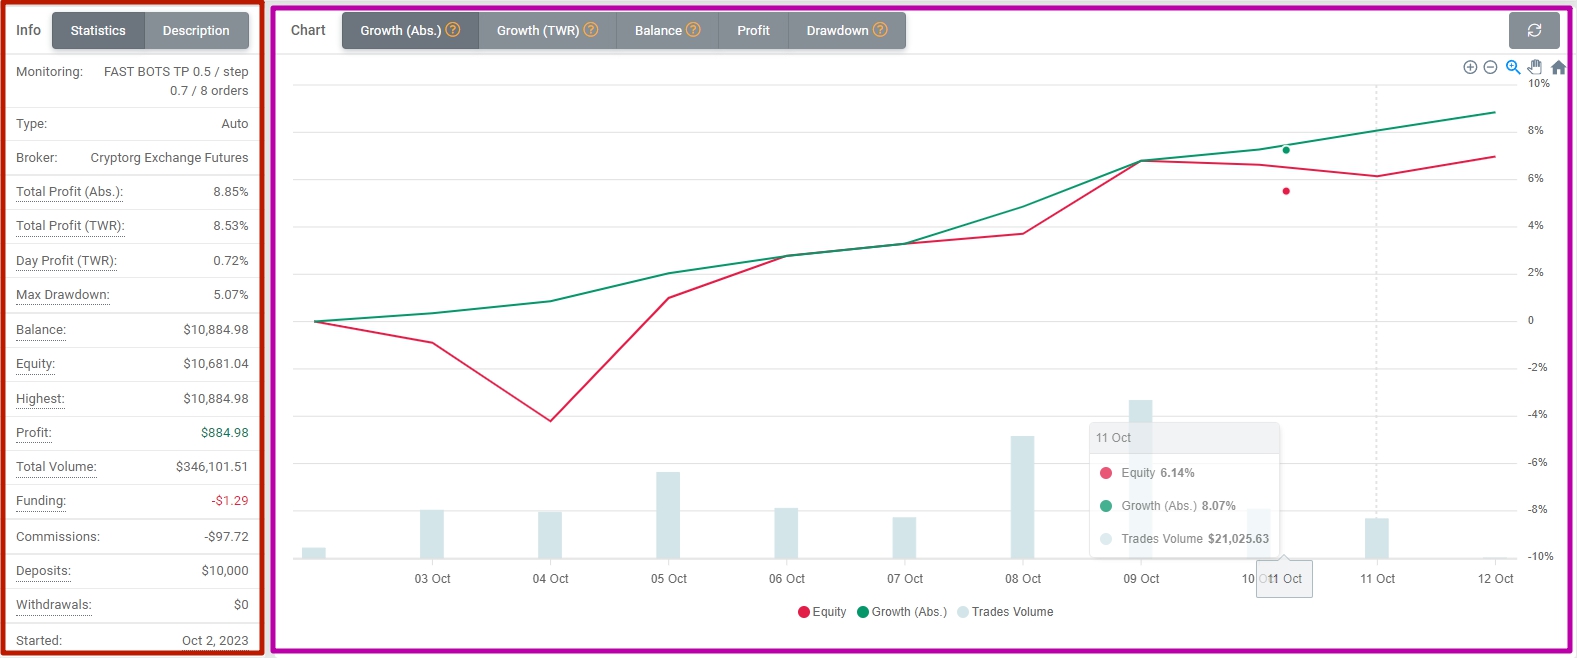
The information block is on the left side of the upper block. It is divided into two parts: Statistics and Description.
Statistics — here many indicators are formed, which are necessary for quick understanding of statistics and what happens in the account.
Description — here specifies the information that the trader sets when generating monitoring.
Graphical block — located on the right side of the upper block and occupies the main space. It consists of 4 main parts: Growth, Balance, Profit, Drawdown.
Growth (Abs) — reflects trading actions that affect the growth and equity of the account in %. Traded volumes are also displayed in the form of bars. This type of calculation is well suited for accounts where there was an initial deposit and no inputs/withdrawals.
Growth (TWR) — reflects trading actions that affect the growth and equity of the account in %. Traded volumes are also displayed in the form of bars. This type of calculation is well suited for accounts where there was an initial deposit and then deposits and withdrawals occur.
Balance — shows the balance and equity of the account in the $ equivalent, taking into account trades, as well as deposits and withdrawals.
Profit — shows trades and account profit/loss in USD equivalent. The bars show the daily profit conveniently.
Drawdown — reflects trading activities and the maximum fixed drawdown on equity.
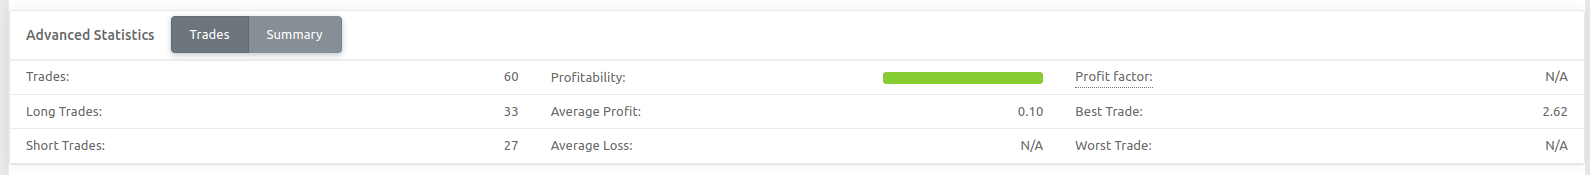
The middle block shows the statistics of performed deals and consists of two parts: Deals and Summary.
Deals — the number of deals, average indicators on them, as well as the profit factor are displayed here.
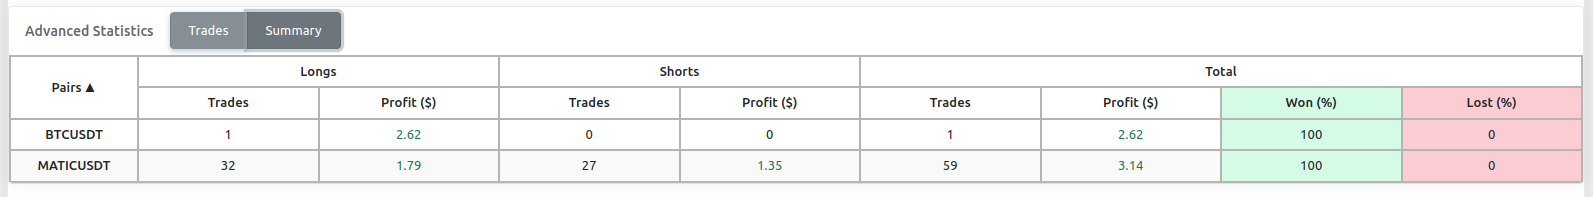
Summary — all trading pairs traded are displayed here. General statistics on successful trades for each pair, as well as separate statistics for long and short trades. This section will show whether you are a Bull or Bear. Columns are clickable, you can sort values from more to less.
Please note that the statistics block is updated after the night cut-off during the day (cut-off at 00 GMT or 3 o’clock Moscow time)
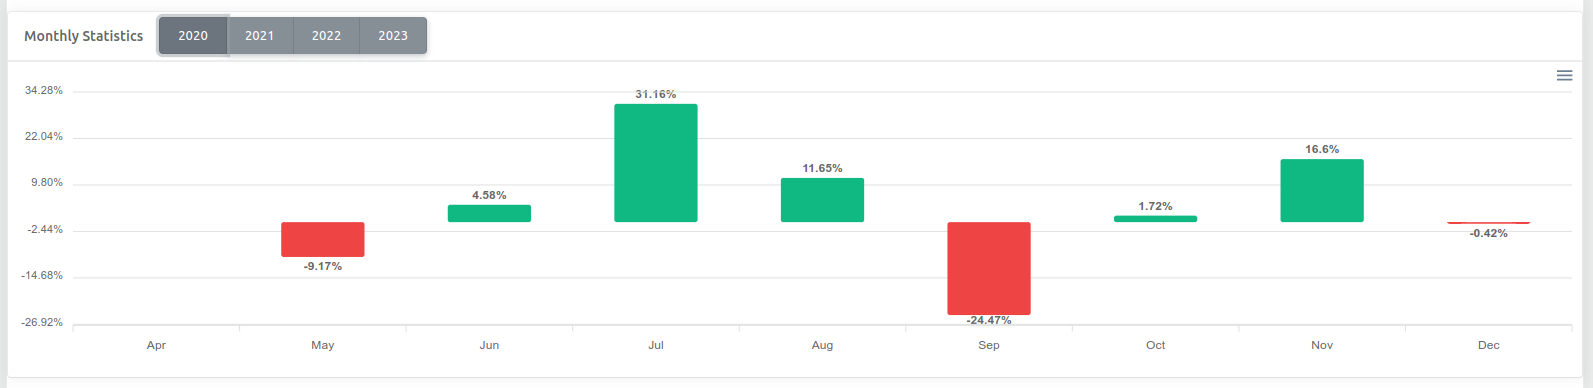
Monthly statistics — statistics of profits on closed trades is formed in % for each month. If the statistics is formed for several years, you can view the monthly returns for each year.
The profitability bars are formed by both Abs% and VVD%. Click on the legend below to leave one of the displays.