
Market Shock
What is Market Shock?
We have created an algorithm that analyzes the «shocks» of the crypto futures market with a capacity of 3% or more and alerts you instantly. We use innovative methods of momentum detection developed by our traders with practical trading experience of more than 10 years. All Binance Futures & Cryptorg Futures trading pairs are taken for observation, except BUSD pairs. Automatic addition of pairs for analysis within seconds after listing.
In May 2024, we added notifications about abnormal Funding to the channel. As soon as the funding rate for a certain pair exceeds + — 0.5%, a notification is sent to the channel.
Signals come in the form of notifications to our Telegram channels:
Binance liquidity https://t.me/market_shock
Bybit liquidity https://t.me/market_shock_bybit
How to read channel notifications quickly and correctly

A signal with circles. Labeled SHOCK. The strongest, shock signal. Indicates that the pulse formation lasted less than 10 seconds. Green color — PUMP. Red color — DAMP.

A signal with squares. It is denoted as SLOW. Indicates that the pulse was formed for a longer period of time, up to 45 seconds
How to read data
In the first line from left to right:
- impulse formation time, the more balls/squares are filled, the stronger the impulse, color indicates the impulse direction
- name of the trading pair with an active link for quick transfer to the Cryptorg futures terminal
- % of the impulse occurred and time in seconds for which the impulse was formed
Line 2:
- type of pulse formation, immediate pulse or smoother pulse
Line 3:
- trading volume of the pair for 24 hours on the base coin
Line 4:
- historical number of signals
Line 5:
- maximum dump of instantaneous pulse in % over history
- maximum momentary pulse pump in % over history
How to use data in real trading
The strategies we identified for ourselves during the test period:
- Work in the opposite direction of the impulse. Such fast impulses often give a pullback. Scalping.
- Work in the direction of the primary impulse on its continuation. Scalping.
- Even if we did not manage to trade the impulse at once, we wait for a pullback and then enter in the direction of the primary impulse.
In all strategies it is desirable to use a grid of orders. Either manually or with the help of Cryptorg bots. If there is a preconfigured bot on a pair with a pulse, you can use the lightning button to quickly start and trade one cycle.
In general, our task as traders is to see abnormal impulses and subsequent volatility for further trading.
I recommend that everyone set a sound signal for notifications from the channel so as not to miss important moments of market activity!
You can also create your own strategy based on our impulses!
Impulse statistics
Pulse Statistics
In your personal account on the page https://cryptorg.net/en/market-shock/statistic you can see detailed statistics of all occurred impulses (you need to be logged into your account to see the table). We collect statistics starting from the end of July 2023. The columns are clickable, you can do various sorting.
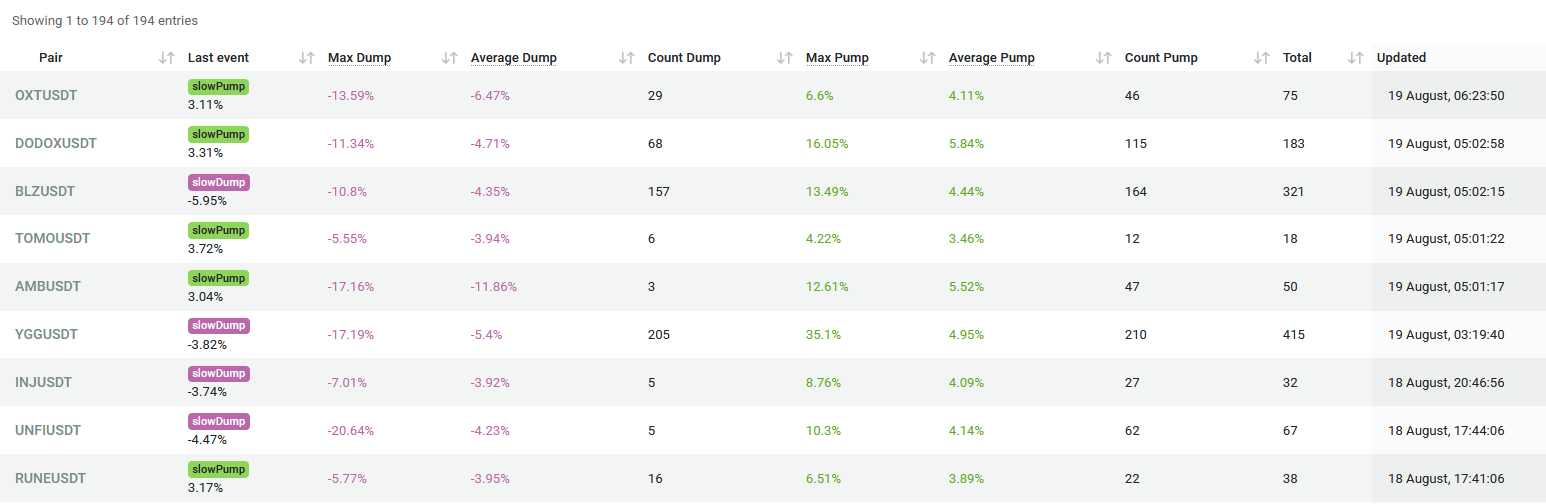
What is this table useful for?
First of all, to understand how volatile and impulsive an asset can be
To build the correct grids of the bot during the period of market activity
How to read abnormal funding data
🔋🕸🕸 one green barrel for funding +0.5 and above
🔋🔋🕸 two green barrels for funding +1% and above
🔋🔋🔋 three green ones for funding +2%
🛢🕸🕸 one red barrel for funding -0.5% and below
🛢🛢🕸 two red barrels for funding -1% and below
🛢🛢🛢three red barrels for funding -2% and below
This way you can always see abnormal funding values and work with them. The more abnormal the funding, the greater the volatility of the asset at the funding rate cutoff!